
Searching for genomic features of transposition events
This scripts takes a user defined genomic region (i.e. chromosome number, region or gene) and creates a dataframe including information about all genomic features in the chromosome (i.e. genes, nc-DNA etc.). This can be used to determine the number of reads outside the genes to use this for normalization of the number of reads in the genes. To run this script, the following files are required and should be placed in the same directory as this file: - chromosome_and_gene_positions.py - chromosome_names_in_files.py - gene_names.py - read_sgdfeatures.py - normalize_reads.py
For the ipython Notebook version of this script with more extensive explanation, see here
This script consists of two functions, dna_features and feature_position.
The function dna_features is the main function that takes user inputs and this function calls the function feature_position which is not intended to be used directly.
The function dna_features takes the following arguments:
region=[int]||[string]||[list] (required)
wig_file=[path] (required)
pergene_insertions_file=[path] (required)
variable="reads"||"insertions"
plotting=True||False
savefigure=True||False
verbose=True||False
The script takes a wig file and a pergene_insertions_file and a genomic region. This genomic region can be:
chromosome number (either roman numeral or integer between 1 and 16)
a list with three arguments: first a number defining the chromosome (again either roman numeral or integer between 1 and 16) second an integer defining the start basepair and third an integer defining an end basepair (e.g. [“I”, 10000, 20000] to get the region between basepair 10000 and 20000 on chromosome 1)
a gene name (e.g. “CDC42”) which will automatically get the corresponding chromosome and basepair position
The plotting argument (True or False) defines whether to create a barplot.
The variable argument determines what to plot, either reads or insertions and the savefigure whether to automatically save the figure at the same location as where this script is stored.
Finally the verbose determines if any printing output should be given (this is mostly useful for when calling this script from other python scripts).
This scripts does not only look at genes, but also at other genomic regions like telomere, centromeres, rna genes etc.
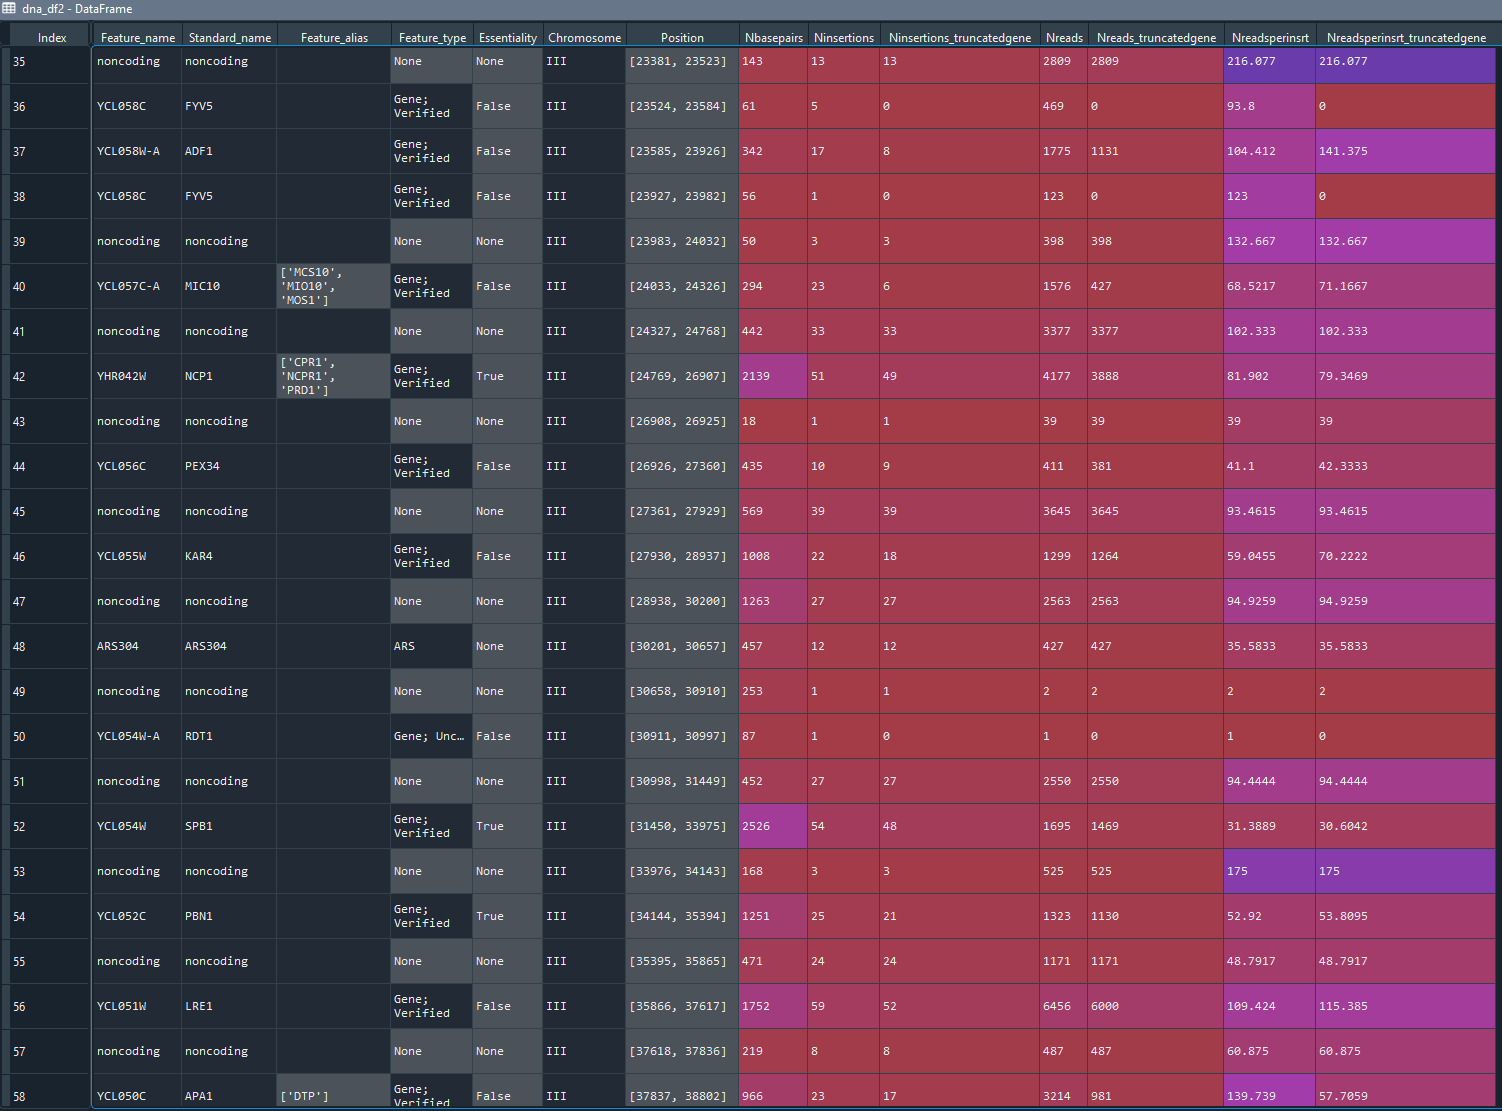
All these features are stored in one dataframe called dna_df2 that includes naming and positional information about the features and the insertion and read counts (see output).
The dataframe will always be created for one entire chromosome (regardless if a basepair region or gene name was entered in the region argument).
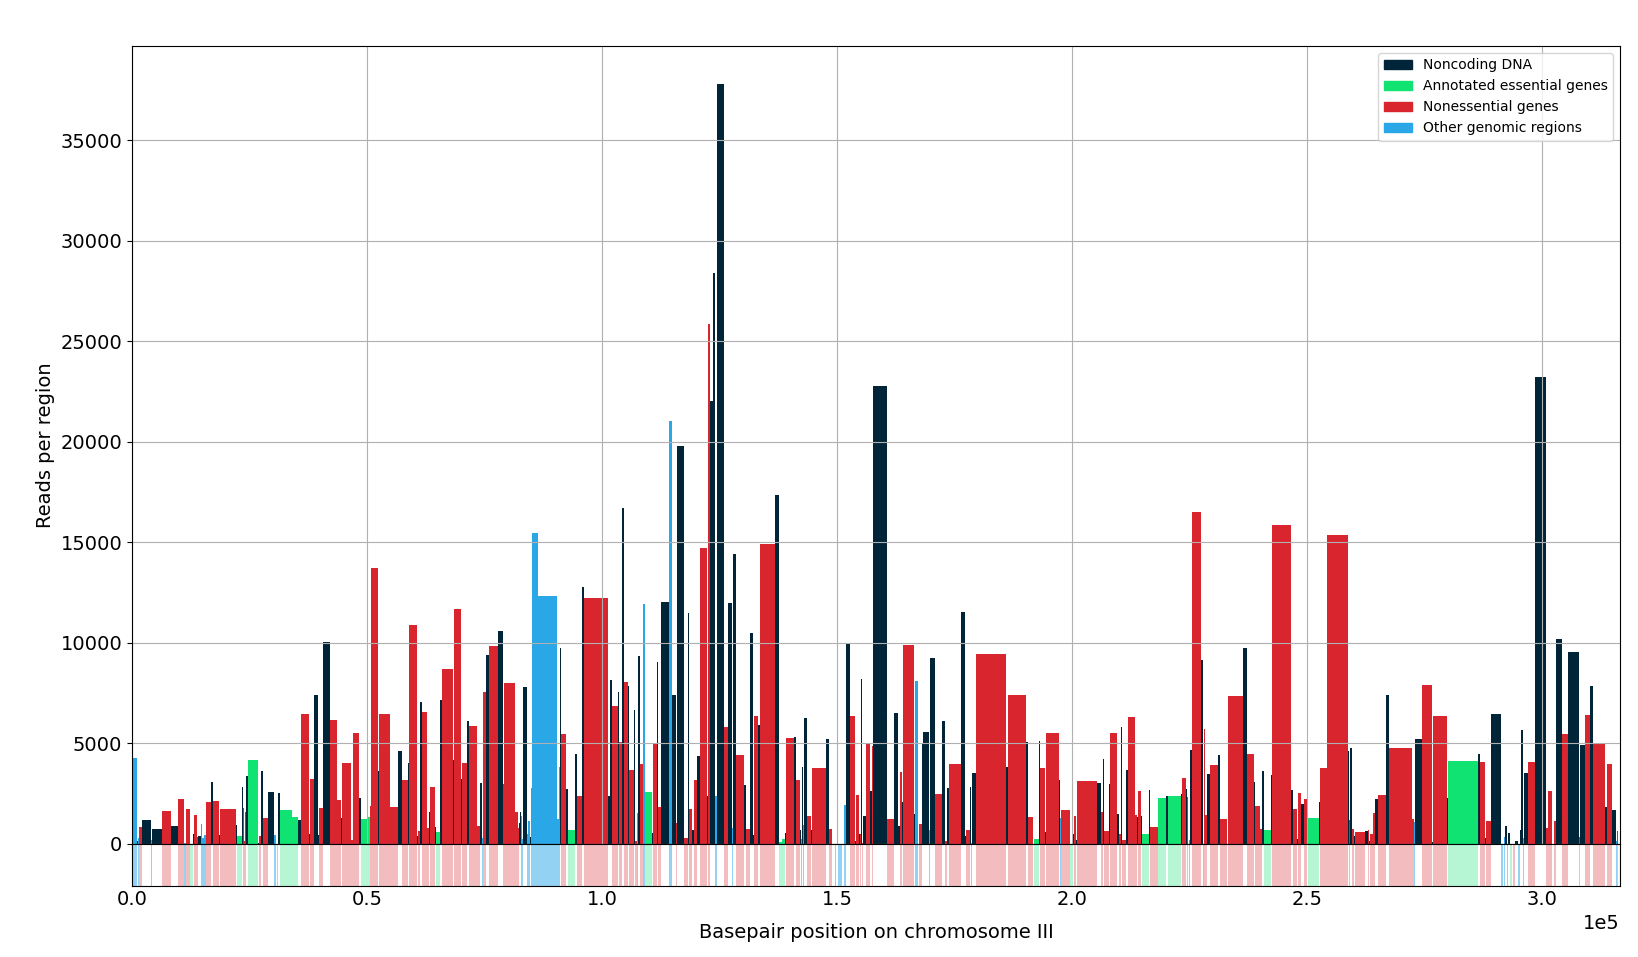
When the plotting is set to the True, it will also create a barplot for the same chromosome within the region that is defined in the region variable.
The plot distinguishes between nonessential genes, essential genes, other genomic features (e.g. telomeres, centromeres etc.) and noncoding dna.
The width of the bars is determined by the length of the genomic feature and the height represents either the number of reads or insertions (depending what is defined in variable).
This function can be useful for other python functions as well when information is required about the positions, insertions and read counts of various genomic features. The full list of genomic features that is regarded in the dataframe is mentioned in read_sgdfeatures.py.
Output
The main output is the dna_df2 dataframe in which each row represents a genomic feature and has the following columns:
Feature name
Feature standard name
Feature aliases (different names for the same feature, mainly for genes)
Essentialilty (only for genes)
Chromosome where feature is located
Position in terms in basepairs
Length of feature in terms of basepairs
Number of insertions in feature
Number of insertions in truncated feature (only for genes, the insertions in the first and last 100bp are ignored, see below)
Sum of reads in feature
Sum of reads in truncated feature (only for genes, where the reads in the first and last 100bp are ignored)
Number of reads per insertion
Number of reads per insertion (only for genes, where the insertions and reads in the first and last 100bp are ignored)
The truncated feature columns ignores basepairs at the beginning and end of a gene. This can be useful as it is mentioned that insertions located at the beginning or end of a gene results in a protein that is still functional (although truncated) (e.g. see Michel et.al. 2017) (see Notes for a further discussion about how this is defined).
When plotting is set to True, a barplot is created where the width of the bars correspond to the width of the feature the bar is representing.
This can be automatically saved at the location where the python script is stored.
The plot is created for an entire chromosome, or it can be created for a specific region, for example when a list is provided in the region argument or when a gene name is given.
Note
The definition for a truncated gene is currently that the first and last 100bp are ignored. This is not completely fair as this is much more stringent for short genes compared to long genes. Alternatively this can be changed to a percentage, for example ignoring the first and last 5 percent of a gene, but this can create large regions in long genes. There is no option to set this directly in the script, but if this needs to be changed, search the script for the following line:
#TRUNCATED GENE DEFINITION. This should give theN10percentvariable that controls the definition of a truncated gene.The barplot currently only takes reads or insertions, but it might be useful to include reads per insertions as well.
Sometimes it can happen that two genomic regions can overlap. When this happens, the dataframe shows a feature, in the next row another feature and then the next row from that it continues with the first feature (e.g. row1; geneA, row2; overlapping feature, row3; geneA). This issue is not automatically solved yet, but best is to, whenever you find a feature, to search if that feature also exists a couple of rows further on. If yes, sum all rows between the first and last occurance of your gene (e.g. in the example above for geneA, sum the values from row1, row2 and row3).
Click here to see the code!
import os, sys
import pandas as pd
import matplotlib.pyplot as plt
import matplotlib.patches as mpatches


file_dirname = os.path.dirname(os.path.abspath('__file__'))
sys.path.insert(1,os.path.join(file_dirname,'python_modules'))
from chromosome_and_gene_positions import chromosome_position, chromosomename_roman_to_arabic, gene_position
from chromosome_names_in_files import chromosome_name_wigfile
from gene_names import list_gene_names, gene_aliases
from read_sgdfeatures import sgd_features


#%%
def dna_features(region, wig_file, pergene_insertions_file, variable="reads", plotting=True, savefigure=False, verbose=True):
    '''This function inputs a wig file and pergene_insertions file created using transposonmapping_satay.py.
    Optional is to define with data is displayed, which can be either "insertions" or "reads".
    Output is a dataframe including major information about all genomic features and optionally a barplot indicating the number of transposons per genomic region.
    A genomic region is here defined as a gene (separated as annotated essential and not essential), telomere, centromere, ars etc.
    This can be used for identifying neutral regions (i.e. genomic regions that, if inhibited, do not influence the fitness of the cells).
    This function can be used for normalizing the transposon insertions per gene using the neutral regions.

    Input:
        - Region: e.g. chromosome number (either a normal number between 1 and 16 or in roman numerals between I and XVI), a list like ['V', 0, 14790] which creates a barplot between basepair 0 and 14790) or a genename.
        - wig_file: wiggle file from the output of transposonmapping.py that is used in the processing workflow.
        - pergene_insertions_file: text file from the output of transposonsmapping.py
        - variable: (only for plotting) either 'insertions' or 'reads', which determines what is being plotted.
        - normalize: (only for plotting) either True or False. Normalization only works for when variable is 'reads'. The normalized reads are plotted and adds a column to the dataframe.
        - normalization_window_size: Integer. Normalization relies on windows that corrects for inter chromosomal differences. This determine the size of those windows in terms of basepairs (default=10000)
        - plotting: Either True or False. Determines whether the barplot has to be created.
        - savefigure: (only for plotting) Whether to save the figure at the same location of this script.
        - Verbose: Either True of False. Determines how much textual feedback is given. When set to False, only warnings will be shown.

    Output:
        - dna_df2: Dataframe containing information about the selected chromosome. This includes the following columns:
            - Feature name
            - Standard name of the feature
            - Aliases of feature name (if any)
            - Feature type (e.g. gene, telomere, centromere, etc. If None, this region is not defined)
            - Chromosome
            - Position of feature type in terms of bp relative to chromosome.
            - Length of region in terms of basepairs
            - Number of insertions in region
            - Number of insertions in truncated region where truncated region is the region without the first and last 100bp.
            - Number of reads in region
            - Number of reads in truncated region.
            - Number of reads per insertion (defined by Nreads/Ninsertions)
            - Number of reads per insertion in truncated region (defined by Nreads_truncatedgene/Ninsertions_truncatedgene)
            NOTE: truncated regions are only determined for genes. For the other regions the truncated region values are the same as the non-truncated region values.

    Required files (see next section):
        - essentials_file: https://github.com/Gregory94/LaanLab-SATAY-DataAnalysis/blob/master/Data_Files/Cerevisiae_AllEssentialGenes_List.txt
        - gene_information_file: https://github.com/Gregory94/LaanLab-SATAY-DataAnalysis/blob/master/Data_Files/Yeast_Protein_Names.txt
        - gff-file: https://github.com/Gregory94/LaanLab-SATAY-DataAnalysis/blob/master/Data_Files/Saccharomyces_cerevisiae.R64-1-1.99.gff3
        - sgd_features_file: https://github.com/Gregory94/LaanLab-SATAY-DataAnalysis/blob/master/Data_Files/SGD_features.tab
    '''
#%% FILES
    essentials_file = os.path.join(file_dirname,'..','data_files',"Cerevisiae_AllEssentialGenes_List.txt")

    gene_information_file = os.path.join(file_dirname,'..','data_files','Yeast_Protein_Names.txt')

    gff_file = os.path.join(file_dirname,'..','data_files','Saccharomyces_cerevisiae.R64-1-1.99.gff3')

    sgd_features_file = os.path.join(file_dirname,'..','data_files','SGD_features.tab')

    variable = variable.lower()
    if plotting == True:
        create_plottitle = ''

#%% DETERMINE INPUTTED REGION

    warningmessage = "WARNING: Specified chromosome or gene name not found. Enter chromosome as a number (or roman numeral) between 1 and 16 (I and XVI), a list in the form ['chromosome number, start_position, end_position'] or a valid gene name."

    if verbose == True:
        print('Selected region: ', region)

    if type(region) == str:
        if region.upper() in chromosomename_roman_to_arabic()[1]:
            chrom = region.upper()
            roi_start = None
            roi_end = None
            region_type = 'Chromosome'

        elif region.upper() in list_gene_names(gene_information_file):
            gene_pos_dict = gene_position(gff_file)
            region = region.upper()
            if region in gene_pos_dict:
                region_pos = gene_pos_dict.get(region)
                chrom = region_pos[0]
                roi_start = int(region_pos[1])
                roi_end = int(region_pos[2])
            else:
                gene_alias_dict = gene_aliases(gene_information_file)[0]
                region_alias = [key for key, val in gene_alias_dict.items() if region in val]
                if not region_alias == [] and region_alias[0] in gene_pos_dict:
                    region_pos = gene_pos_dict.get(region_alias[0])
                    chrom = region_pos[0]
                    roi_start = int(region_pos[1])-100
                    roi_end = int(region_pos[2])+100
                    del (region_alias, gene_alias_dict)
                else:
                    print(warningmessage)
                    return()
            if plotting == True:
                create_plottitle = region
            region_type = 'Gene'
            del (region_pos, gene_pos_dict)

        else:
            print(warningmessage)
            return()


    elif type(region) == list:
        if type(region[0]) == str:
            chrom = region[0].upper()
        elif type(region[0]) == int:
            if region[0] in chromosomename_roman_to_arabic()[0]:
                chrom = chromosomename_roman_to_arabic()[0].get(region[0])
        else:
            print(warningmessage)
            return()
        roi_start = region[1]
        roi_end = region[2]
        region_type = 'Chromosome'


    elif type(region) == int:
        if region in chromosomename_roman_to_arabic()[0]:
            chrom = chromosomename_roman_to_arabic()[0].get(region)
            roi_start = None
            roi_end = None
        else:
            print(warningmessage)
            return()
        region_type = 'Chromosome'


    else:
        print(warningmessage)
        return()


    del (warningmessage)

#%% READ WIG FILE FOR GETTING LOCATIONS OF ALL TN INSERTIONS

    with open(wig_file, 'r') as f:
        lines = f.readlines()

    chrom_start_line_dict, chrom_end_line_dict = chromosome_name_wigfile(lines)[1:]

    insrt_in_chrom_list = []
    reads_in_chrom_list = []
    for l in lines[chrom_start_line_dict.get(chrom):chrom_end_line_dict.get(chrom)]:
        insrt_in_chrom_list.append(int(l.strip('\n').split(' ')[0]))
        reads_in_chrom_list.append(int(l.strip('\n').split(' ')[1]))

    del (lines, l, f, chrom_start_line_dict, chrom_end_line_dict)

#%% READ PERGENE_INSERTIONS FILE FOR LOCATION OF ALL INSERTIONS PER EACH GENE.

    with open(pergene_insertions_file) as f:
        lines = f.readlines()


    gene_position_dict = {}
    for line in lines[1:]:
        line_split = line.strip('\n').split('\t')


        if line_split[1] == chrom:
            genename = line_split[0]
            gene_chrom = line_split[1]
            gene_start = int(line_split[2])
            gene_end = int(line_split[3])

            gene_position_dict[genename] = [gene_chrom, gene_start, gene_end] #DICT CONTAINING ALL GENES WITHIN THE DEFINED CHROMOSOME INCLUDING ITS START AND END POSITION


            geneinserts_str = line_split[4].strip('[]')
            if not geneinserts_str == '':
                geneinserts_list = [int(ins) for ins in geneinserts_str.split(',')]
            else:
                geneinserts_list = []


            genereads_str = line_split[5].strip('[]')
            if not genereads_str == '':
                genereads_list = [int(read) for read in genereads_str.split(',')]
            else:
                genereads_list = []


            if len(geneinserts_list) != len(genereads_list):
                print('WARNING: %s has different number of reads compared with the number of inserts' % genename )


    del (f, lines, line, line_split, genename, gene_chrom, gene_start, gene_end, geneinserts_list, geneinserts_str, genereads_str, genereads_list)

#%% DETERMINE THE LOCATION GENOMIC FEATURES IN THE CURRENT CHROMOSOME AND STORE THIS IN A DICTIONARY

    len_chr = chromosome_position(gff_file)[0].get(chrom)
    start_chr = chromosome_position(gff_file)[1].get(chrom)
    end_chr = chromosome_position(gff_file)[2].get(chrom)
    if verbose == True:
        print('Chromosome length = ', len_chr)

    dna_dict = {} #for each bp in chromosome, determine whether it belongs to a noncoding or coding region
    for bp in range(start_chr, end_chr + 1): #initialize dna_dict with all basepair positions as ['noncoding', None]
        dna_dict[bp] = ['noncoding', None] #form is: ['element_name', 'type']


    feature_orf_dict = sgd_features(sgd_features_file)[1]
    gene_alias_dict = gene_aliases(gene_information_file)[0]


    for gene in gene_position_dict:
        if gene in feature_orf_dict:
            if (not gene.endswith("-A") and not feature_orf_dict.get(gene)[1] == 'Verified') and (not gene.endswith("-B") and not feature_orf_dict.get(gene)[1] == 'Verified'):
                for bp in range(gene_position_dict.get(gene)[1]+start_chr, gene_position_dict.get(gene)[2]+start_chr+1):
                    dna_dict[bp] = [gene, "Gene; "+feature_orf_dict.get(gene)[1]]
        else:
            gene_alias = [key for key, val in gene_alias_dict.items() if gene in val][0]
            for bp in range(gene_position_dict.get(gene)[1]+start_chr, gene_position_dict.get(gene)[2]+start_chr+1):
                dna_dict[bp] = [gene_alias, "Gene; "+feature_orf_dict.get(gene_alias)[1]]


    del (gff_file, gene, bp, gene_alias)

#%% GET FEATURES FROM INTERGENIC REGIONS (-> SEE SGD_features.tab IN DATA_FILES IN GITHUB FOLDER)

    genomicregions_list = sgd_features(sgd_features_file)[0]

    i = 2
    for genomicregion in genomicregions_list[1:]:
        dna_dict = feature_position(sgd_features(sgd_features_file)[i], chrom, start_chr, dna_dict, genomicregion)
        i += 1


    ### TEST IF ELEMENTS IN FEATURE_ORF_DICT FOR SELECTED CHROMOSOME ARE THE SAME AS THE GENES IN GENE_POSITION_DICT BY CREATING THE DICTIONARY FEATURE_POSITION_DICT CONTAINING ALL THE GENES IN FEATURE_ORF_DICT WITH THEIR CORRESPONDING POSITION IN THE CHROMOSOME
    gene_alias_dict = gene_aliases(gene_information_file)[0]
    orf_position_dict = {}
    for feature in feature_orf_dict:
        if feature_orf_dict.get(feature)[5] == chrom:
            if feature in gene_position_dict:
                orf_position_dict[feature] = [feature_orf_dict.get(feature)[6], feature_orf_dict.get(feature)[7]]
            else:
                for feature_alias in gene_alias_dict.get(feature):
                    if feature_alias in gene_position_dict:
                        orf_position_dict[feature_alias] = [feature_orf_dict.get(feature)[6], feature_orf_dict.get(feature)[7]]


    if sorted(orf_position_dict) == sorted(gene_position_dict):
        if verbose == True:
#            print('Everything alright, just ignore me!')
            pass
        else:
            pass
    else:
        print('WARNING: Genes in feature_list are not the same as the genes in the gene_position_dict. Please check!')


    del (sgd_features_file, feature_orf_dict, orf_position_dict, feature, feature_alias, gene_position_dict)

#%% DETERMINE THE NUMBER OF TRANSPOSONS PER BP FOR EACH FEATURE

    reads_loc_list = [0] * len(dna_dict) # CONTAINS ALL READS JUST LIKE READS_IN_CHROM_LIST, BUT THIS LIST HAS THE SAME LENGTH AS THE NUMBER OF BP IN THE CHROMOSOME WHERE THE LOCATIONS WITH NO READS ARE FILLED WITH ZEROS
    i = 0
    for ins in insrt_in_chrom_list:
        reads_loc_list[ins] = reads_in_chrom_list[i]
        i += 1


    del (i, ins, insrt_in_chrom_list, reads_in_chrom_list)#, dna_df)

#%% CREATE DATAFRAME FOR EACH FEATURE (E.G. NONCODING DNA, GENE, ETC.) IN THE CHROMOSOME AND DETERMINE THE NUMBER OF INSERTIONS AND READS PER FEATURE.

    feature_NameAndType_list = []
    f_previous = dna_dict.get(start_chr)[0]
    f_type = dna_dict.get(start_chr)[1]
    N_reads = []
    N_reads_list = []
    N_reads_truncatedgene_list = []
    N_insrt_truncatedgene_list = []
    N_insrt_list = []
    N_bp = 1
    N_bp_list = []
    f_start = 0
    f_end = 0
    f_pos_list = []
    i = 0
    for bp in dna_dict:
        f_current = dna_dict.get(bp)[0]
        if f_current == f_previous:
            f_type = dna_dict.get(bp)[1]
            f_end += 1
            N_bp += 1
            N_reads.append(reads_loc_list[i])
        elif (f_current != f_previous or (i+start_chr) == end_chr):# and not f_current.endswith('-A'):
            feature_NameAndType_list.append([f_previous, f_type])
            N_reads_list.append(sum(N_reads))
            N_insrt_list.append(len([ins for ins in N_reads if not ins == 0]))
            if not f_type == None and f_type.startswith('Gene'):
                N10percent = 100#int(len(N_reads) * 0.1) #TRUNCATED GENE DEFINITION
                N_reads_truncatedgene_list.append(sum(N_reads[N10percent:-N10percent]))
                N_insrt_truncatedgene_list.append(len([ins for ins in N_reads[N10percent:-N10percent] if not ins == 0]))
            else:
                N_reads_truncatedgene_list.append(sum(N_reads))
                N_insrt_truncatedgene_list.append(len([ins for ins in N_reads if not ins == 0]))

            N_bp_list.append(N_bp)
            N_reads = []
            N_bp = 1
            f_pos_list.append([f_start, f_end+f_start])
            f_start = f_start + f_end + 1
            f_end = 0
            f_previous = f_current
        i += 1

    N_reads_per_ins_list = []
    N_reads_per_ins_truncatedgene_list = []
    for i in range(len(N_reads_list)):
        if N_insrt_list[i] == 0:
            N_reads_per_ins_list.append(0)
            N_reads_per_ins_truncatedgene_list.append(0)
        elif N_insrt_truncatedgene_list[i] == 0:
            N_reads_per_ins_list.append(N_reads_list[i]/N_insrt_list[i])
            N_reads_per_ins_truncatedgene_list.append(0)
        else:
            N_reads_per_ins_list.append(N_reads_list[i]/N_insrt_list[i])
            N_reads_per_ins_truncatedgene_list.append(N_reads_truncatedgene_list[i]/N_insrt_truncatedgene_list[i])


    #############get all essential genes together with their aliases##############
    with open(essentials_file, 'r') as f:
        essentials_temp_list = f.readlines()[1:]
    essentials_list = [essential.strip('\n') for essential in essentials_temp_list]
    del essentials_temp_list

    gene_alias_dict = gene_aliases(gene_information_file)[0]
    for key, val in gene_alias_dict.items():
        if key in essentials_list:
            for alias in val:
                essentials_list.append(alias)

    #ADD
    essentiality_list = []
    for feature in feature_NameAndType_list:
        if not feature[0] == "noncoding":
            if feature[1] in genomicregions_list:
                essentiality_list.append(None)
            elif feature[0] in essentials_list:
                essentiality_list.append(True)
            else:
                essentiality_list.append(False)
        else:
            essentiality_list.append(None)

    del (key, val, alias, essentials_list, feature, gene_information_file)#, gene_alias_dict)#, reads_loc_list)
    ##############################################################################

    feature_name_list = []
    feature_type_list = []
    feature_alias_list = []
    feature_standardname_list = []
    for feature_name in feature_NameAndType_list:
        feature_name_list.append(feature_name[0])
        feature_type_list.append(feature_name[1])
        if feature_name[1] != None and feature_name[1].startswith('Gene') and feature_name[0] in gene_alias_dict:
            if gene_alias_dict.get(feature_name[0])[0] == feature_name[0]:
                feature_standardname_list.append(feature_name[0])
                feature_alias_list.append('')
            else:
                if len(gene_alias_dict.get(feature_name[0])) > 1:
                    feature_standardname_list.append(gene_alias_dict.get(feature_name[0])[0])
                    feature_alias_list.append(gene_alias_dict.get(feature_name[0])[1:])
                else:
                    feature_standardname_list.append(gene_alias_dict.get(feature_name[0])[0])
                    feature_alias_list.append('')
        else:
            feature_standardname_list.append(feature_name[0])
            feature_alias_list.append('')


    all_features = {'Feature_name': feature_name_list,
                    'Standard_name': feature_standardname_list,
                    'Feature_alias':feature_alias_list,
                    'Feature_type': feature_type_list,
                    'Essentiality': essentiality_list,
                    'Chromosome': [chrom]*len(feature_name_list),
                    'Position': f_pos_list,
                    'Nbasepairs':N_bp_list,
                    'Ninsertions':N_insrt_list,
                    'Ninsertions_truncatedgene':N_insrt_truncatedgene_list,
                    'Nreads':N_reads_list,
                    'Nreads_truncatedgene':N_reads_truncatedgene_list,
                    'Nreadsperinsrt':N_reads_per_ins_list,
                    'Nreadsperinsrt_truncatedgene':N_reads_per_ins_truncatedgene_list}


    dna_df2 = pd.DataFrame(all_features, columns = [column_name for column_name in all_features]) #search for feature using: dna_df2.loc[dna_df2['Feature'] == 'CDC42']
    #CREATE NEW COLUMN WITH ALL DOMAINS OF THE GENE (IF PRESENT) AND ANOTHER COLUMN THAT INCLUDES LISTS OF THE BP POSITIONS OF THESE DOMAINS


    #PRINT INFORMATION FOR THE SELECTED GENE
    if region_type == 'Gene':
        for region_info in dna_df2.itertuples():
            if region_info.Feature_name == region.upper() or region_info.Standard_name == region.upper():
                print(region_info)


    del (dna_dict, feature_NameAndType_list, feature_name_list, feature_type_list, feature_name, f_type, f_previous, f_start, f_end, f_pos_list, f_current, N_reads, N_reads_list, N_insrt_list, N_reads_truncatedgene_list, N_insrt_truncatedgene_list, N10percent, N_bp, N_bp_list, bp, i, start_chr, end_chr, all_features, essentiality_list, essentials_file, genomicregions_list)


#%% CREATE BAR PLOT
    if plotting == True:
        noncoding_color = "#002538"
        essential_color = "#10e372"
        nonessential_color = "#d9252e"
        codingdna_color = '#29a7e6'
        textcolor = "#000000"
        textsize = 14


        feature_middle_pos_list = []
        sum_bp = 0
        for x in dna_df2['Nbasepairs']:
            feature_middle_pos_list.append(x/2 + sum_bp)
            sum_bp += x
        del (x, sum_bp)

        feature_width_list = list(dna_df2['Nbasepairs'])


        barcolor_list = []
        for feature in dna_df2['Feature_name']:
            if feature == 'noncoding':
                barcolor_list.append(noncoding_color)
            elif dna_df2.loc[dna_df2['Feature_name'] == feature]['Essentiality'].iloc[0] == False:
                barcolor_list.append(nonessential_color)
            elif dna_df2.loc[dna_df2['Feature_name'] == feature]['Essentiality'].iloc[0] == True:
                barcolor_list.append(essential_color)
            elif dna_df2.loc[dna_df2['Feature_name'] == feature]['Essentiality'].iloc[0] == None:
                barcolor_list.append(codingdna_color)
        del (feature)


        ###PLOTTING
        plt.figure(figsize=(19,9))
        grid = plt.GridSpec(20, 1, wspace=0.0, hspace=0.01)


        ax = plt.subplot(grid[0:19,0])
        if variable == "insertions":
            ax.bar(feature_middle_pos_list, list(dna_df2['Ninsertions']), feature_width_list, color=barcolor_list)
            ax.set_ylabel("Transposons per region", fontsize=textsize, color=textcolor)
        elif variable == "reads":
            ax.bar(feature_middle_pos_list, list(dna_df2['Nreads']), feature_width_list, color=barcolor_list)
            ax.set_ylabel("Reads per region", fontsize=textsize, color=textcolor)


        if roi_start != None and roi_end != None and roi_start < len_chr and roi_end < len_chr:
            ax.set_xlim(roi_start, roi_end)
        else:
            ax.set_xlim(0, len_chr)

        ax.grid(linestyle='-', alpha=1.0)
        ax.tick_params(labelsize=textsize)
    #    ax.set_xticklabels([])
        ax.tick_params(axis='x', which='major', pad=30)
        ax.ticklabel_format(axis='x', style='sci', scilimits=(0,0))
        ax.xaxis.get_offset_text().set_fontsize(textsize)
        ax.set_xlabel("Basepair position on chromosome "+chrom, fontsize=textsize, color=textcolor, labelpad=10)
        ax.set_title(create_plottitle, fontsize=textsize, color=textcolor)
        legend_noncoding = mpatches.Patch(color=noncoding_color, label="Noncoding DNA")
        legend_essential = mpatches.Patch(color=essential_color, label="Annotated essential genes")
        legend_nonessential = mpatches.Patch(color=nonessential_color, label="Nonessential genes")
        legend_coding = mpatches.Patch(color=codingdna_color, label="Other genomic regions")
        leg = ax.legend(handles=[legend_noncoding, legend_essential, legend_nonessential, legend_coding]) #ADD
        for text in leg.get_texts():
            text.set_color(textcolor)
        del text

        axc = plt.subplot(grid[19,0])

        l = 0
        counter = 0
        for width in feature_width_list:
            if dna_df2.loc[counter][4] == True:
                axc.axvspan(l,l+width,facecolor=essential_color,alpha=0.3)
            elif dna_df2.loc[counter][4] == False and not dna_df2.loc[counter][0] == 'noncoding':
                axc.axvspan(l,l+width,facecolor=nonessential_color,alpha=0.3)
            elif dna_df2.loc[counter][4] == None and not dna_df2.loc[counter][0] == 'noncoding':
                axc.axvspan(l,l+width,facecolor=codingdna_color,alpha=0.5)
            l += width
            counter += 1
        if roi_start != None and roi_end != None and roi_start < len_chr and roi_end < len_chr:
            axc.set_xlim(roi_start, roi_end)
        else:
            axc.set_xlim(0, len_chr)
        axc.tick_params(labelsize=textsize)
        axc.set_yticklabels([])
        axc.tick_params(
            axis='x',          # changes apply to the x-axis
            which='both',      # both major and minor ticks are affected
            bottom=False,      # ticks along the bottom edge are off
            top=False,         # ticks along the top edge are off
            labelbottom=False) # labels along the bottom edge are off

        axc.tick_params(
            axis='y',          # changes apply to the y-axis
            which='both',      # both major and minor ticks are affected
            left=False,        # ticks along the bottom edge are off
            right=False,       # ticks along the top edge are off
            labelleft=False)   # labels along the bottom edge are off


        if savefigure == True:
            if variable == 'reads':
                saving_name = os.path.join(file_dirname,'GenomicFeaturesReads_Barplot_Chrom'+chrom+'_NonNormalized')
            else:
                saving_name = os.path.join(file_dirname,'GenomicFeaturesInsertions_Barplot_Chrom'+chrom+'_NonNormalized')
            plt.savefig(saving_name, orientation='landscape', dpi=200)
            plt.close()

        del (barcolor_list, codingdna_color, essential_color, feature_middle_pos_list, feature_width_list, noncoding_color, nonessential_color, textcolor, textsize, l, counter, width)


#%% RETURN STATEMENT
    return(dna_df2)


def feature_position(feature_dict, chrom, start_chr, dna_dict, feature_type=None):

    position_dict = {}
    for feat in feature_dict:
        if feature_dict.get(feat)[5] == chrom:
#            if feat.startswith("TEL") and feat.endswith('L'): #correct for the fact that telomeres at the end of a chromosome are stored in the reverse order.
            if int(feature_dict.get(feat)[6]) > int(feature_dict.get(feat)[7]):
                position_dict[feat] = [feature_dict.get(feat)[5], feature_dict.get(feat)[7], feature_dict.get(feat)[6]]
            else:
                position_dict[feat] = [feature_dict.get(feat)[5], feature_dict.get(feat)[6], feature_dict.get(feat)[7]]


    for feat in position_dict:
        for bp in range(int(position_dict.get(feat)[1])+start_chr, int(position_dict.get(feat)[2])+start_chr):
            if dna_dict[bp] == ['noncoding', None]:
                dna_dict[bp] = [feat, feature_type]
            else:
#                print('Bp %i is already occupied by %s' % (bp, str(dna_dict.get(bp))))
                pass


    return(dna_dict)
How to use the code in the same script
region = 1 #e.g. 1, "I", ["I", 0, 10000"], gene name (e.g. "CDC42")
wig_file = r""
pergene_insertions_file = r""
plotting=True
variable="reads" #"reads" or "insertions"
savefigure=False
verbose=True
if __name__ == '__main__':
    dna_df2 = dna_features(region=region,
                 wig_file=wig_file,
                 pergene_insertions_file=pergene_insertions_file,
                 variable=variable,
                 plotting=plotting,
                 savefigure=savefigure,
                 verbose=verbose)