Research questions behind the use of SATAY
Contents
Research questions behind the use of SATAY
About 20% of the genes in wild type Saccharomyces Cerevisiae are essential, meaning that they cannot be deleted without crippling the cell to such an extent that it either cannot survive (lethality) or multiply (sterility).
(Non)-essentiality of genes is not constant over different genetic backgrounds, but genes can gain or lose essentiality when other genes are mutated. Moreover, it is expected that the interactions between genes changes in mutants (changes in the interaction map). This raises a number of questions:
If a gene x gains or loses essentiality after a mutation in gene y, does the essentiality of gene y also changes if a mutation in gene x is provoked?
After a mutation that reduces the fitness of a population of cells, the population is sometimes able to increase its fitness by mutating other genes (e.g. dBem1 eventually result in mutations in Bem3). Can these mutations, that are initiated by cells themselves, be predicted based on the interaction maps (i.e. predict survival of the fittest)?
If a gene x is suppressed, it will possibly change the essentiality of another gene. It is expected that most changes in essentiality will occur in the same subnetwork of the mutated gene. If a gene y is suppressed that is part of the same network as gene x, does this invoke similar changes in this subnetwork?
Transposon sequencing in other organisms
There is a project called galaxyproject website which explains it in the context of bacteria, but the same principles hold for yeast cells.
Determine essentiality based on transposon counts
Using the number of transposons and reads, it can be determined which genes are potentially essential and which are not.
To check this method, the transposon count for wild type cells are determined. Currently, genes that are taken as essential are the annotated essentials based on previous research.
We can use statitiscal learning methods to find what is the expected number of transposons per essential gene. See this Matlab Code done by one of our Master students in our lab, Wessel Teunisse.
Distribution number of insertions and reads compared with essential and non-essential genes
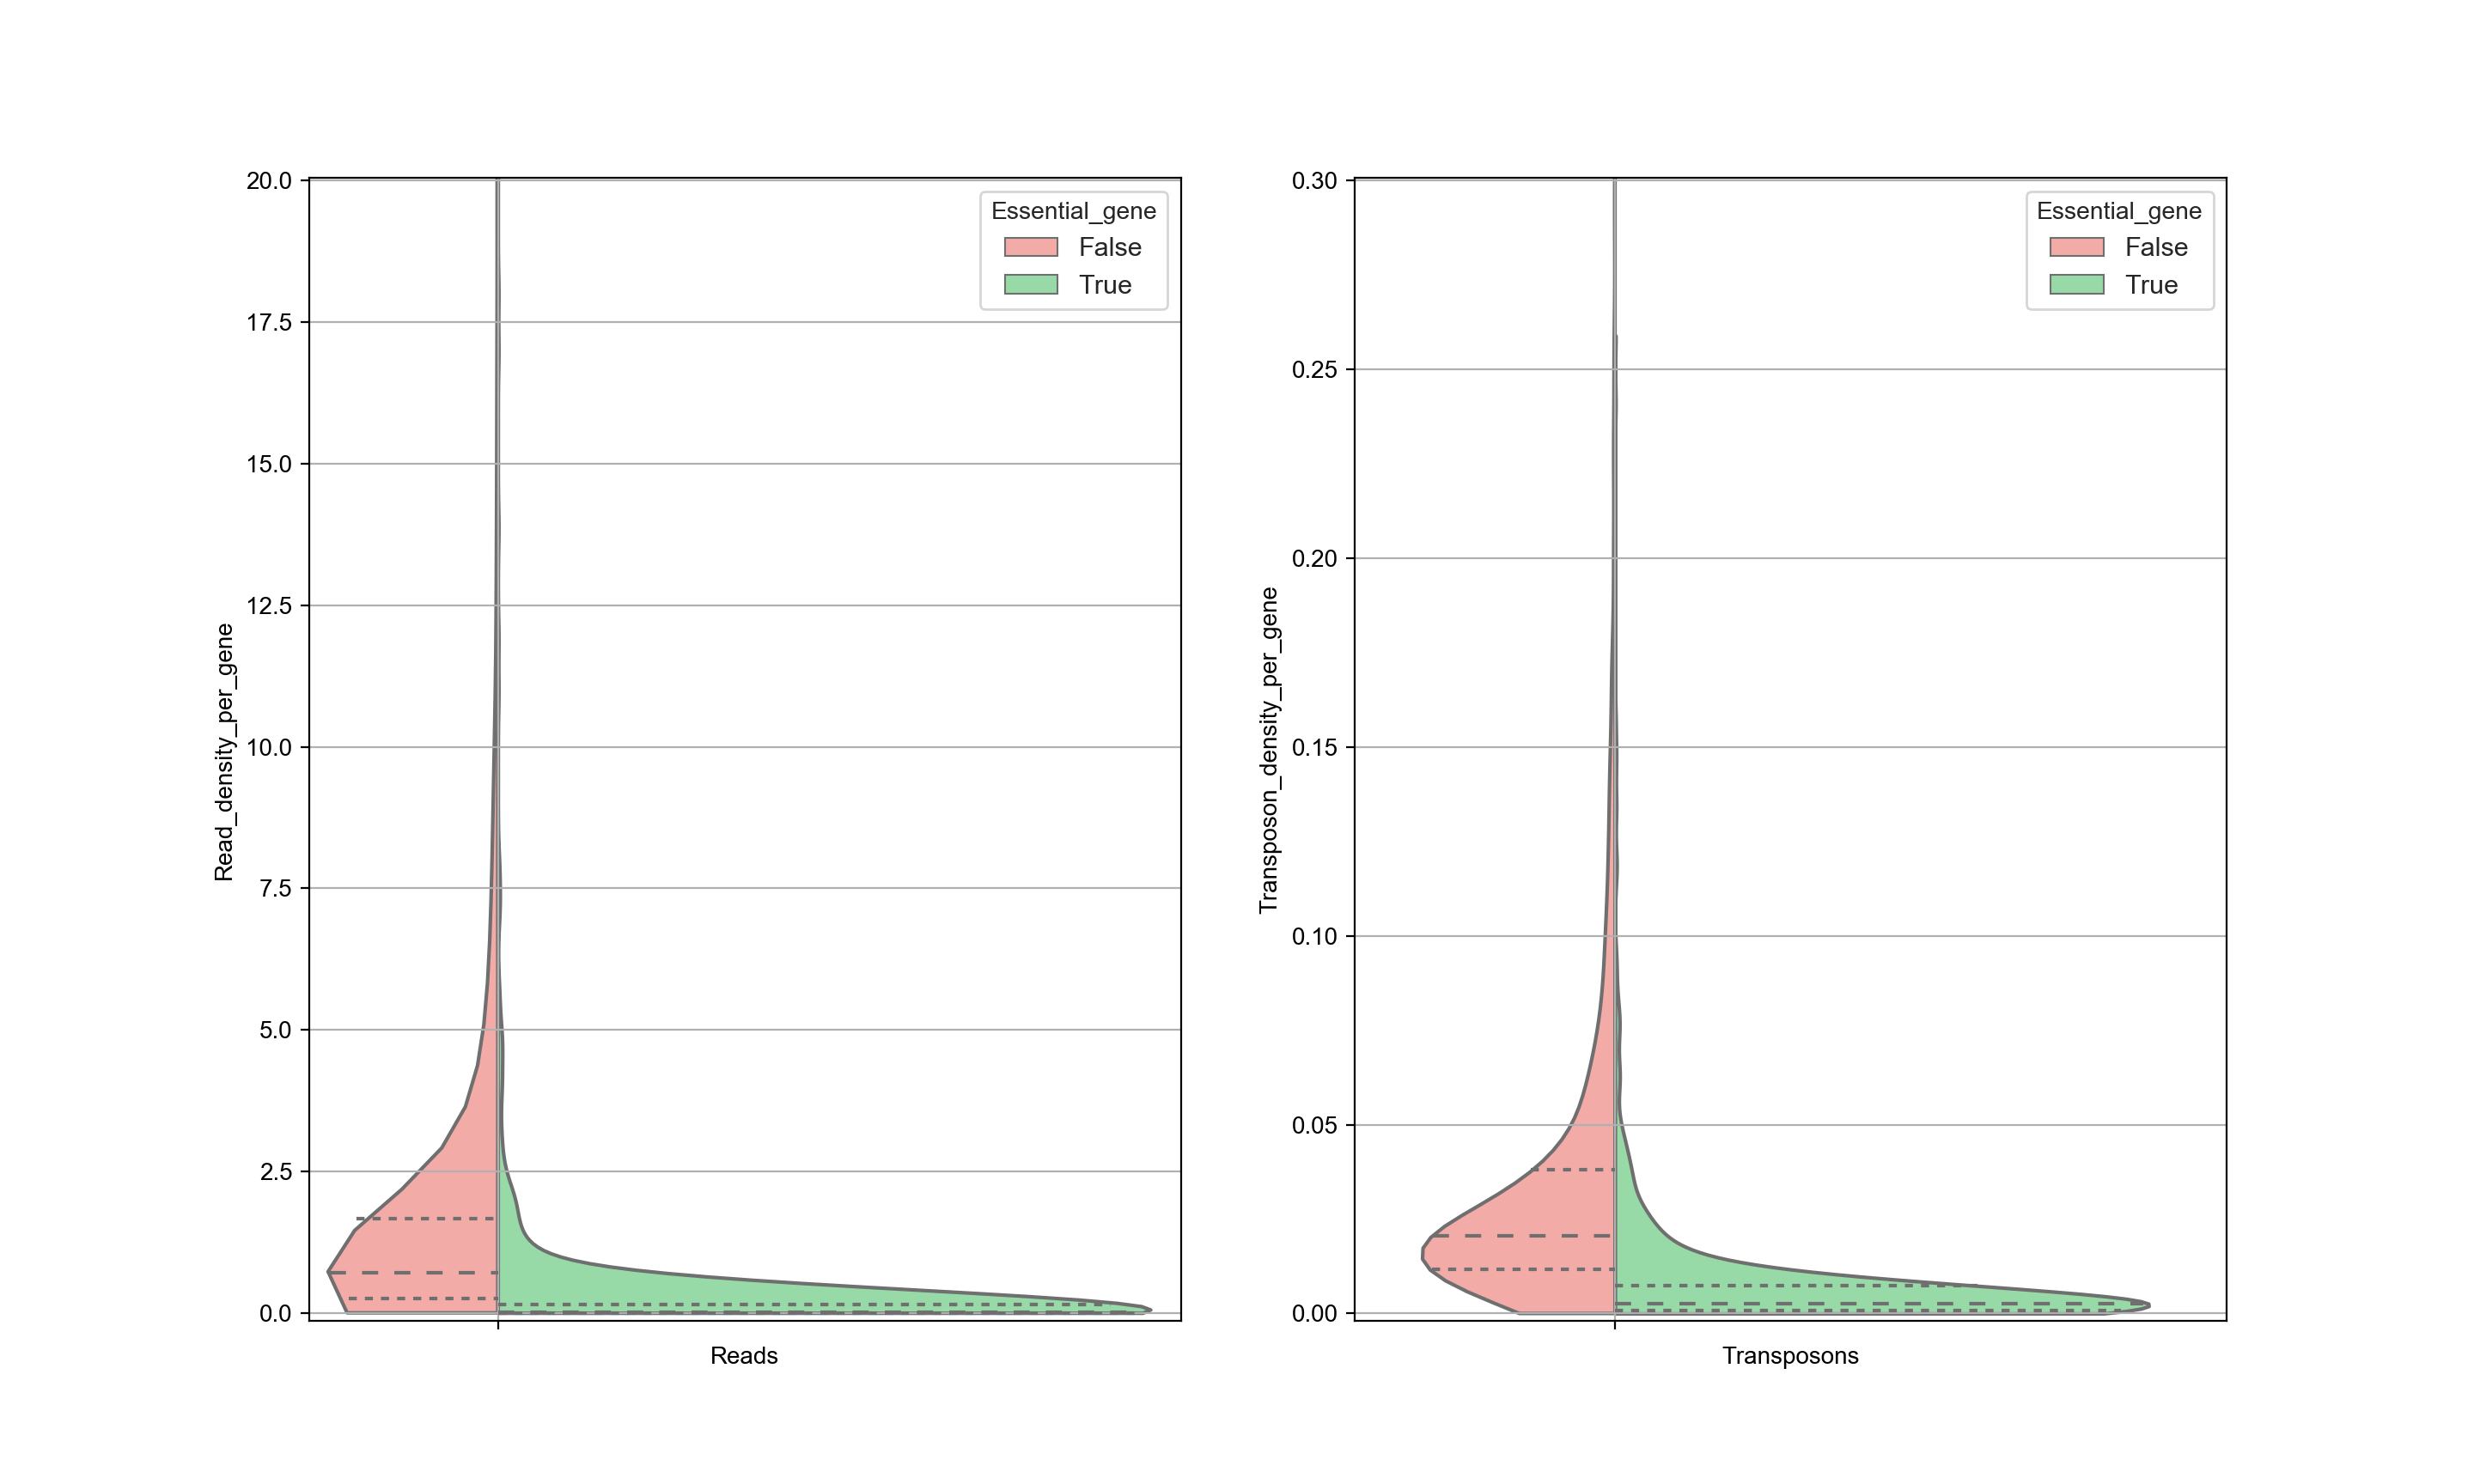
Ideally, the number of transposon insertions of all essential genes are small and the number of insertions in non-essential genes are is large so that there is a clear distinction can be made. However, this is not always so clear. For example, the distribution of transposons in WT cells in the data from Michel et. al. looks like this:

In this figure, both the reads and the transposon counts are normalized with respect to the length of each gene (hence the graph represents the read density and transposon density). High transposon counts only occurs for non-essential genes, and therefore when a high transposon count is seen, it can be assigned nonessential with reasonable certainty. However, when the transposon count is low the there is a significant overlap between the two distributions and therefore there is no certainty whether this gene is essential or not (see also the section about ‘Interpreting Transposon Counts & Reads’).
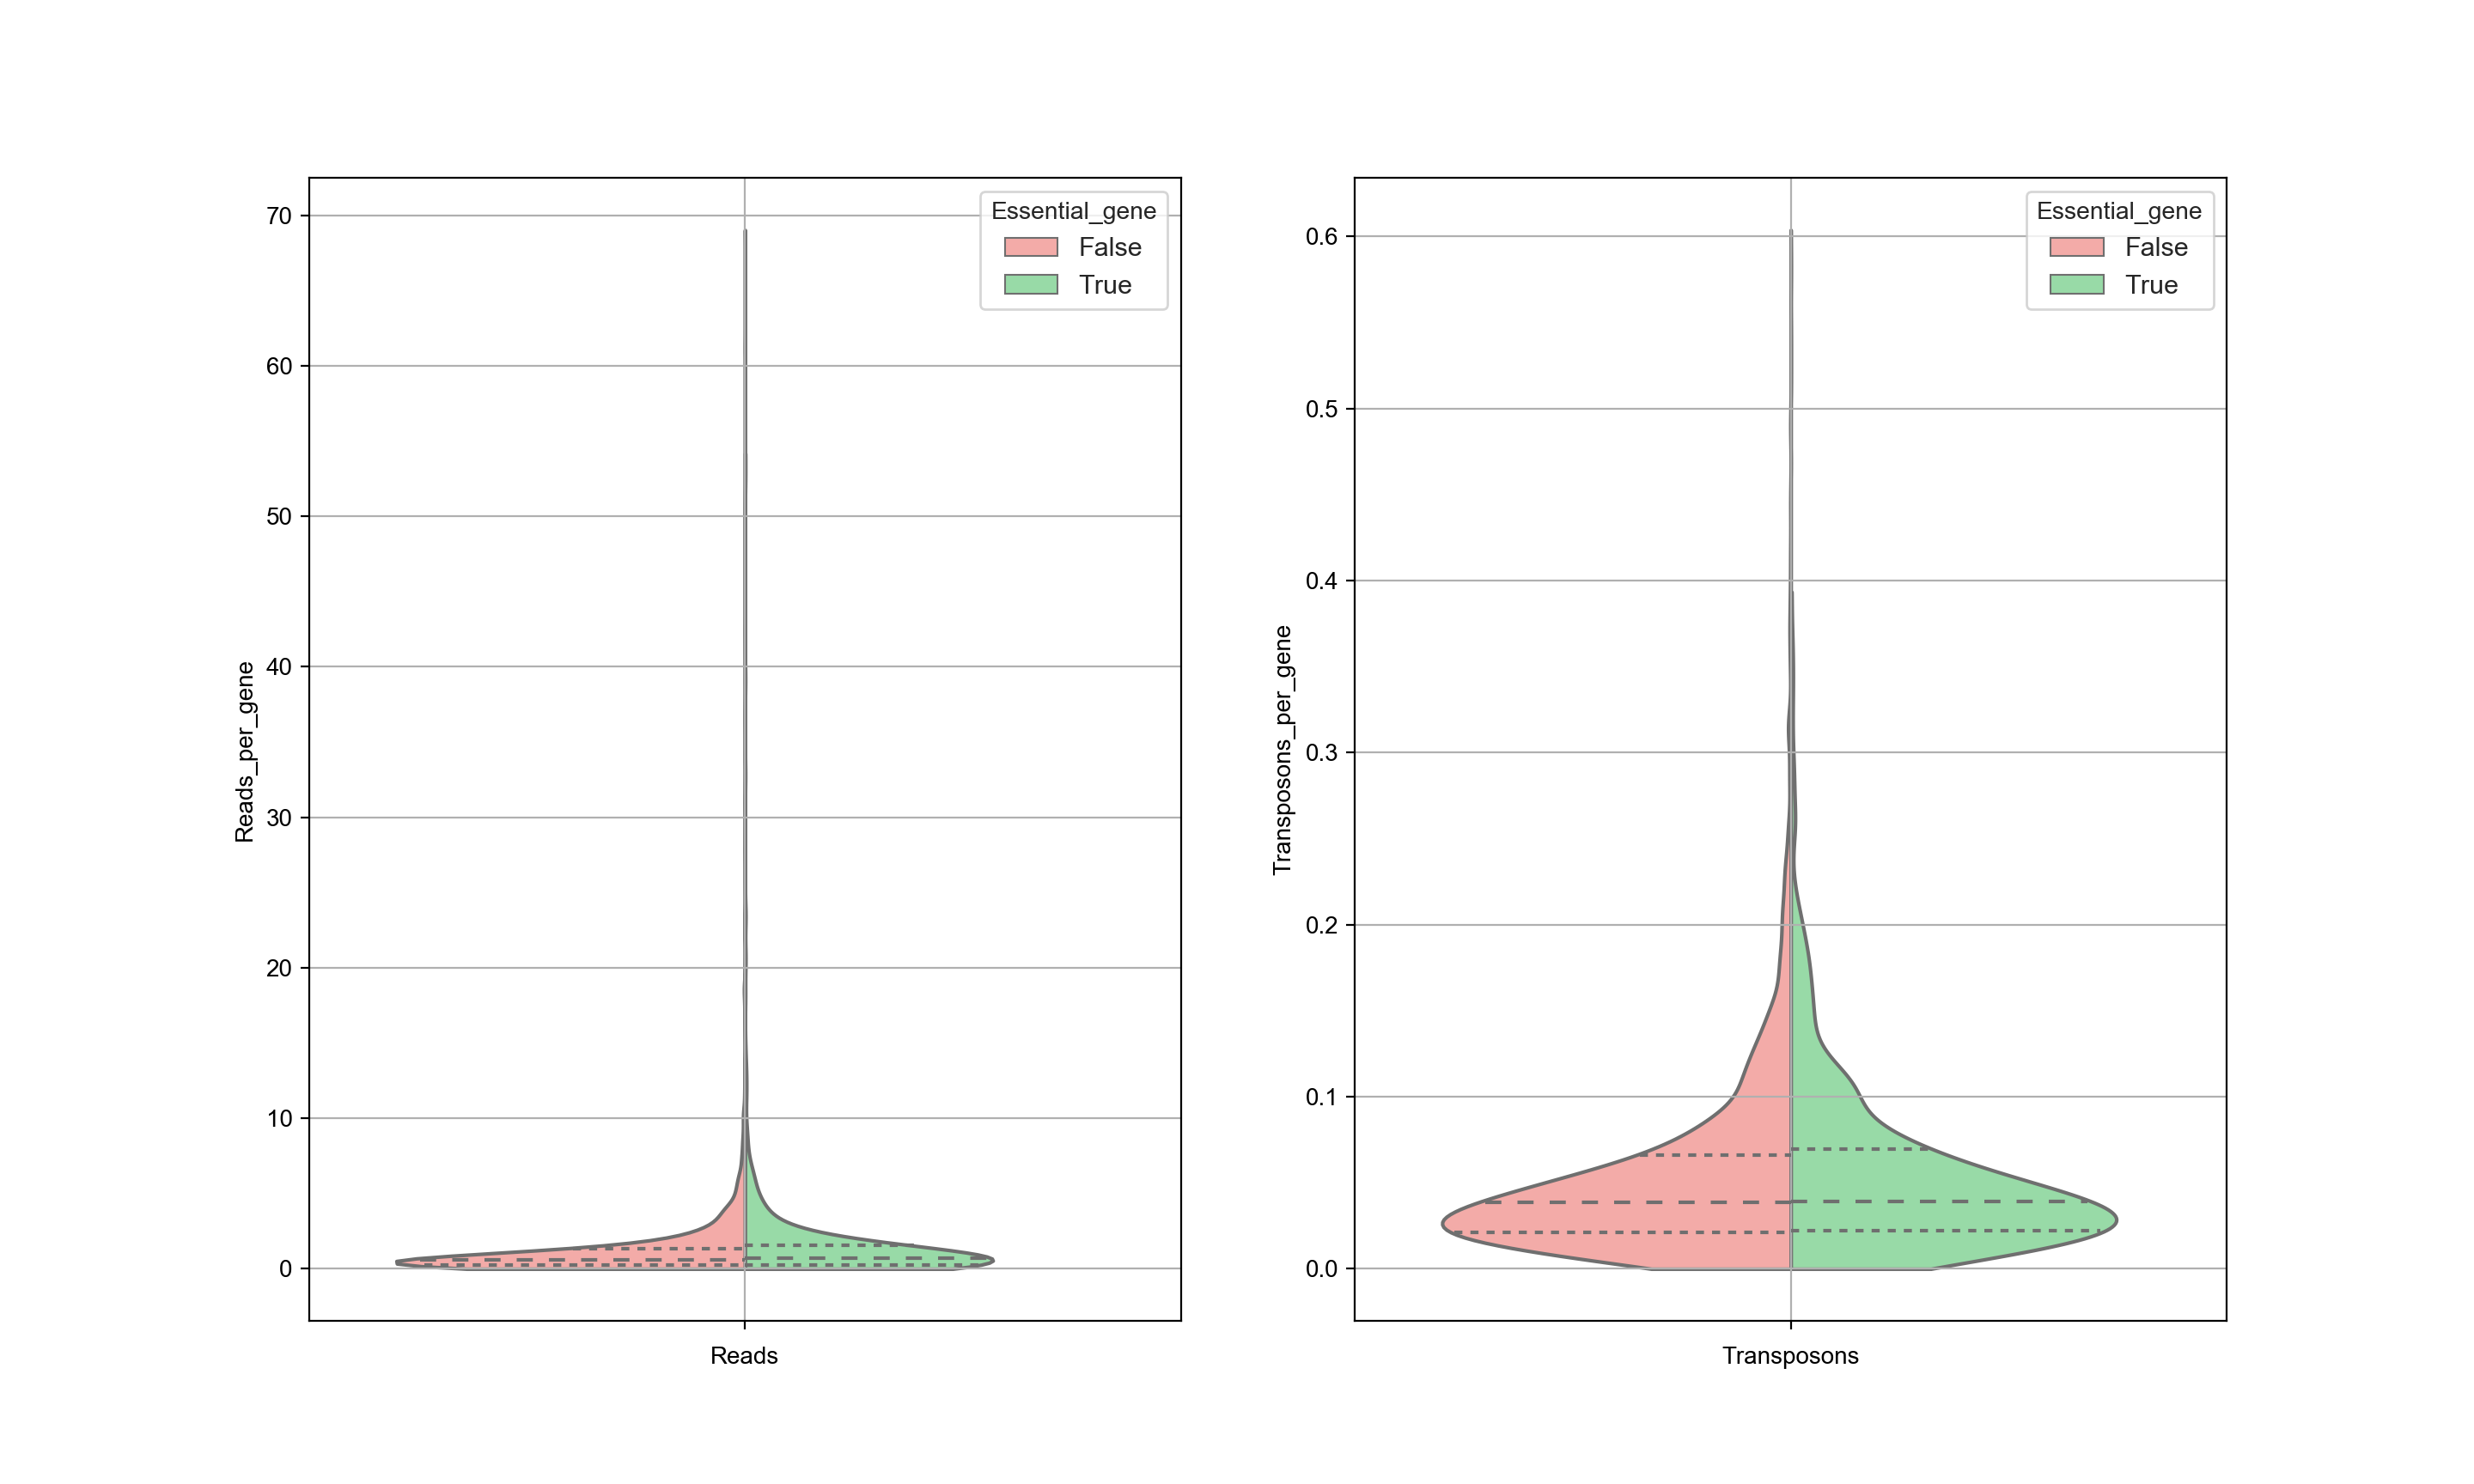
The data is also sensitive to postprocessing. It is expected that the trimming of the sequences is an important step. The graph below shows the same data as in the previous graph, but with different processing as is done by Michel et. al… This has a significant influence on the results and as a consequence, no distinction can be made between essential and nonessential genes based on the transposon counts. Significant attention needs to be given to the postprocessing of the data.

Profile plot for number of reads
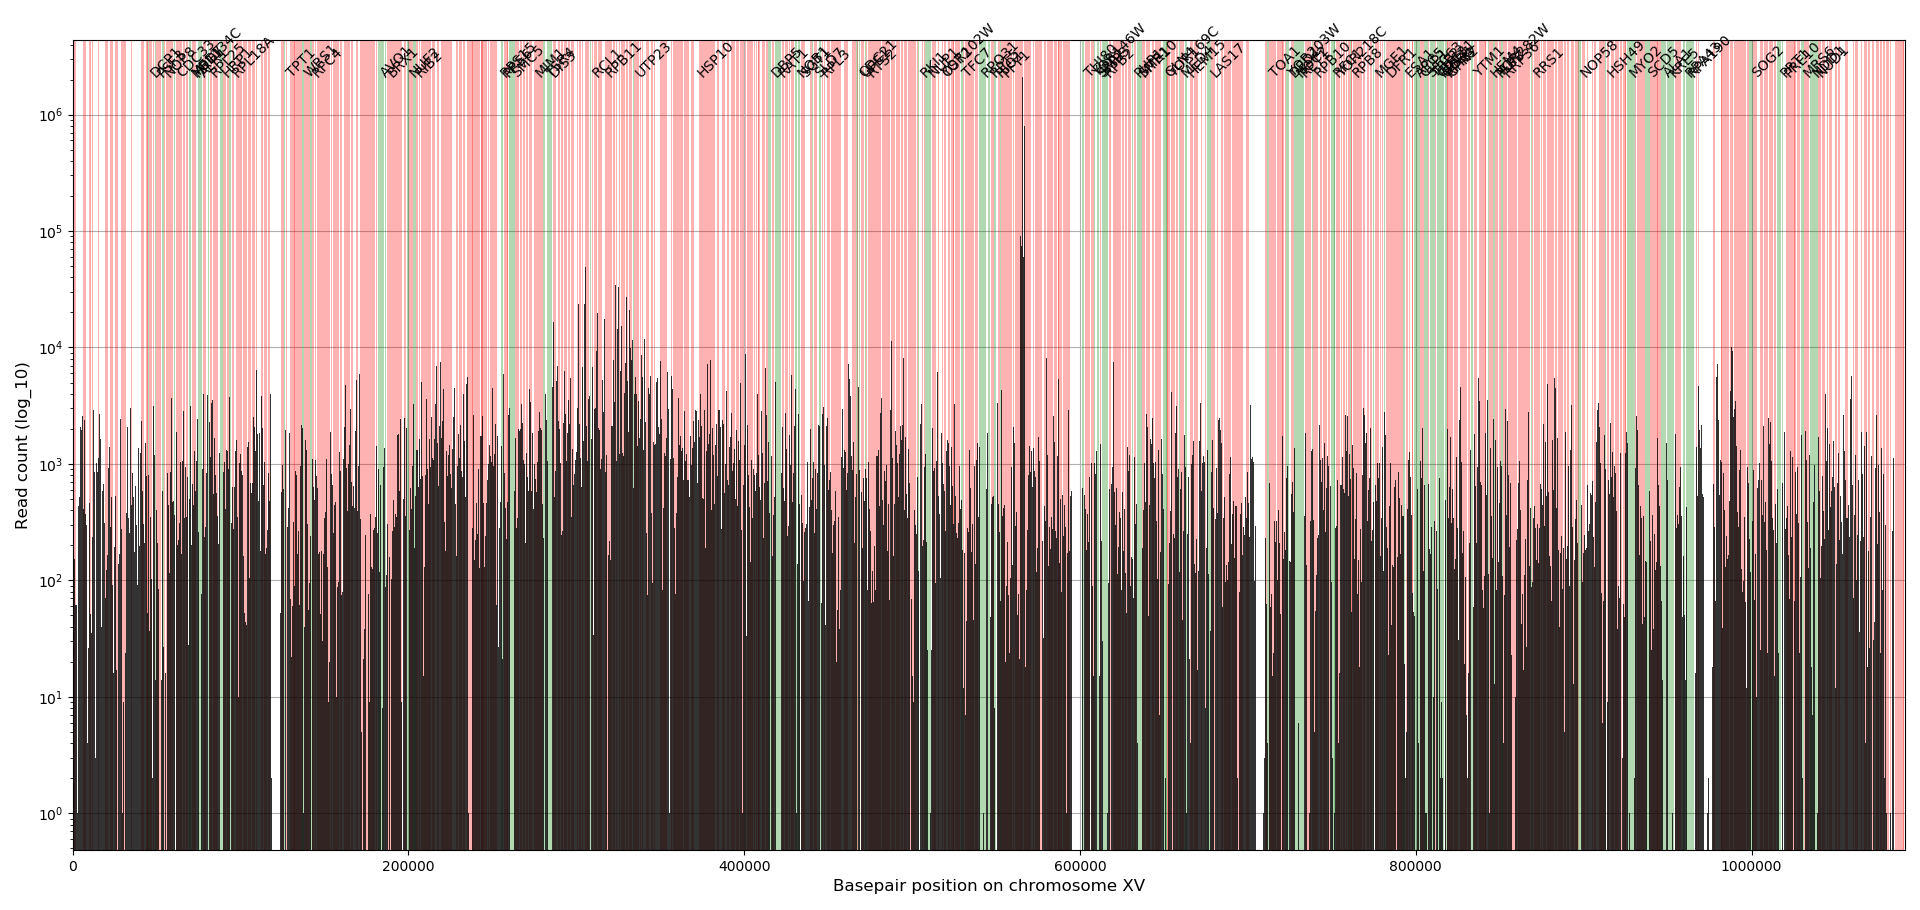
To create a visual overview where the insertions are and how many reads there are for each insertion, a profile plot is created for each chromosome.

The bars indicate the absolute number of reads for all insertions located in the bars (bar width is 545bp). The colored background indicate the location of genes, where green are the annotated essential genes and red the non-essential genes. In general, the essential genes have no or little reads whereas the non-essential genes have many reads. Note that at location 564476 the ADE2 gene is located that has significant more reads than any other location in the genome, which has to do the way the plasmid is designed (see Michel et.al. 2017). The examples used here are from a dataset discussed in the paper by Michel et.al. 2017 which used centromeric plasmids where the transposons are excised from. The transposons tend to reinsert in the chromosome near the chromosomal pericentromeric region causing those regions to have about 20% more insertions compared to other chromosomal regions.
