Tutorial-3: Visualize the insertions and reads per gene throughout the genome
After following the steps in Tutorial-2 : How to clean the wig and bed files. we have proper clean files to continue our analysis.
Import the function
from transposonmapper.processing.transposonread_profileplot_genome import profile_genome
Lets save the cleaned files as variables to clean them and call the function.
Lets use our dummy files that were outputed after running transposonmapper in Tutorial-2 : How to clean the wig and bed files.
cleanbed_files=[]
for root, dirs, files in os.walk(data_dir):
    for file in files:
        if file.endswith("clean.bed"):
            cleanbed_files.append(os.path.join(root, file))

cleanwig_files=[]
for root, dirs, files in os.walk(data_dir):
    for file in files:
        if file.endswith("clean.wig"):
            cleanwig_files.append(os.path.join(root, file))
Vizualization
bed_file=cleanbed_files[0] # example for the 1st file
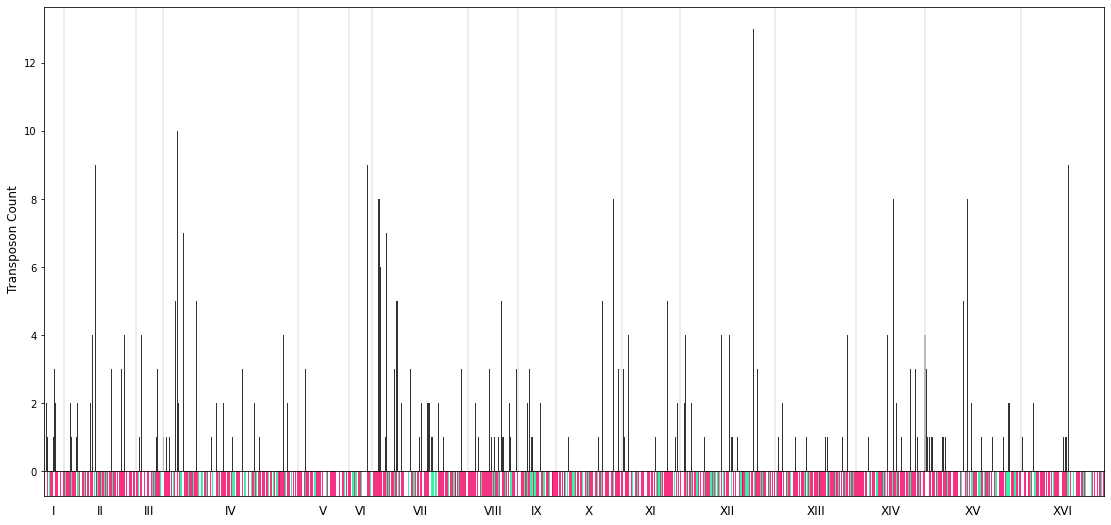
variable="transposons" #"reads" "transposons"
bar_width=None
savefig=False
profile=profile_genome(bed_file=bed_file, variable=variable, bar_width=bar_width, savefig=savefig,showfig=True)
This is the plot for the case of the dummy sample files.