Tutorial-5: Volcano plots
**Do you want to compare two differente libraries to discover which genes stood out from their comoparison? **
Then do volcano plots!
Import the function
from transposonmapper.statistics import volcano
Getting the volcano plot
Look at the help of this function , HERE
path_a = r""
filelist_a = ["",""]
path_b = r""
filelist_b = ["",""]


variable = 'read_per_gene' #'read_per_gene' 'tn_per_gene', 'Nreadsperinsrt'
significance_threshold = 0.01 #set threshold above which p-values are regarded significant
normalize=True

trackgene_list = ['my-favorite-gene'] # ["cdc42"]


figure_title = " "

volcano_df = volcano(path_a=path_a, filelist_a=filelist_a,
            path_b=path_b, filelist_b=filelist_b,
            variable=variable,
            significance_threshold=significance_threshold,
            normalize=normalize,
            trackgene_list=trackgene_list,
            figure_title=figure_title)
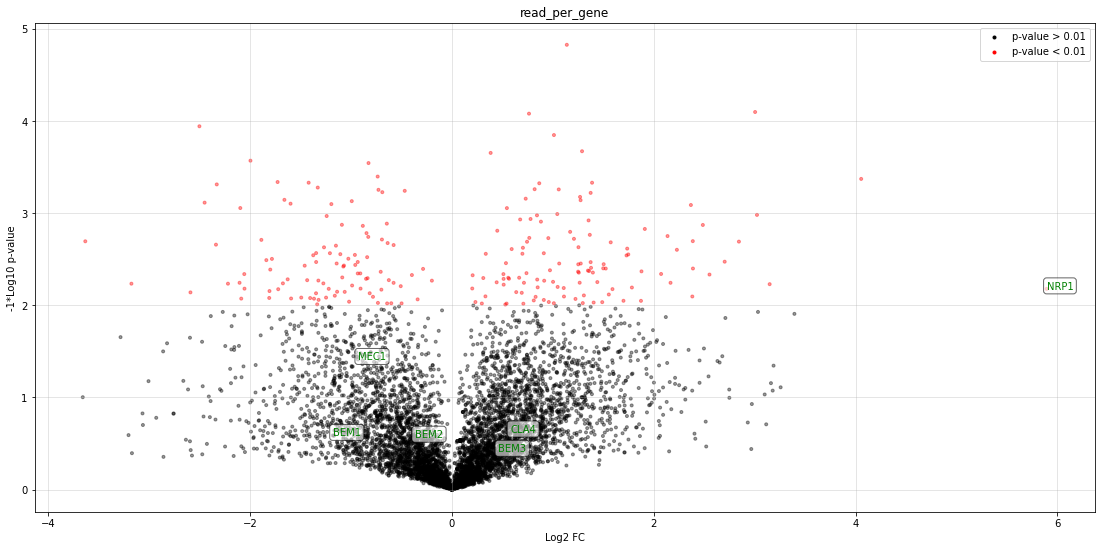
This is a volcano plot made with real data!